
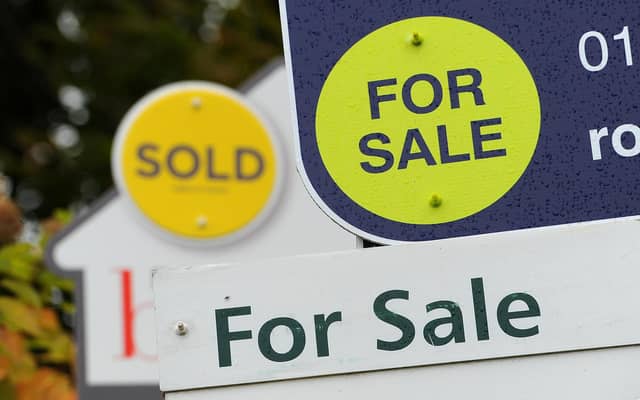


Using Land Registry data for England and Wales, Hamptons defined a flipped property as one bought and sold within a 12-month window. In the first quarter of 2025, just 2.3% of homes sold had been flipped — the lowest rate since early 2013, when the figure was also 2.3%. This marks a significant decline from 3.6% recorded during the same period in 2024.
The average gross profit — the difference between purchase and sale price before accounting for other costs — on a flipped home in Q1 2025 was £22,000. This figure includes both profitable and loss-making sales, as well as those that broke even. While 80% of flipped homes sold during this period turned a gross profit, Hamptons noted that the actual share of profitable sales would be lower once stamp duty (or land transaction tax in Wales) was factored in.
Gross profits have nearly halved since their 2022 peak of £38,000. According to Hamptons, rising costs for materials and labour, combined with slower house price growth, have dampened investor interest in short-term property resales.
Despite the overall decline, the North East of England continues to be a hotspot for flipping. Redcar and Cleveland, in particular, stood out, with 4.7% of all homes sold in the region during Q1 2025 having been purchased within the previous year.
Regionally, 61% of flipped homes in the first quarter of 2025 were located in the Midlands, the North of England, or Wales — up from 50% a decade earlier. In contrast, London saw just 1.5% of homes sold during this period having changed hands within the past 12 months, with stamp duty costs and subdued price growth further reducing returns for investors in the capital.
Here are the proportions of home sales which are flipped by region and nation, followed by the average gross profit (before costs such as stamp duty) in cash and percentage terms:
- North East, 4.7%, £14,250, 12%
- Wales, 3.1%, £25,000, 17%
- Yorkshire and the Humber, 3.0%, £18,995, 11%
- East Midlands, 2.8%, £13,500, 7%
- North West, 2.8%, £25,000, 16%
- West Midlands, 2.5%, £25,000, 15%
- South West, 2.2%, £20,000, 8%
- East of England, 1.8%, £22,000, 7%
- South East, 1.8%, £23,000, 7%
- London, 1.5%, £59,000, 16%
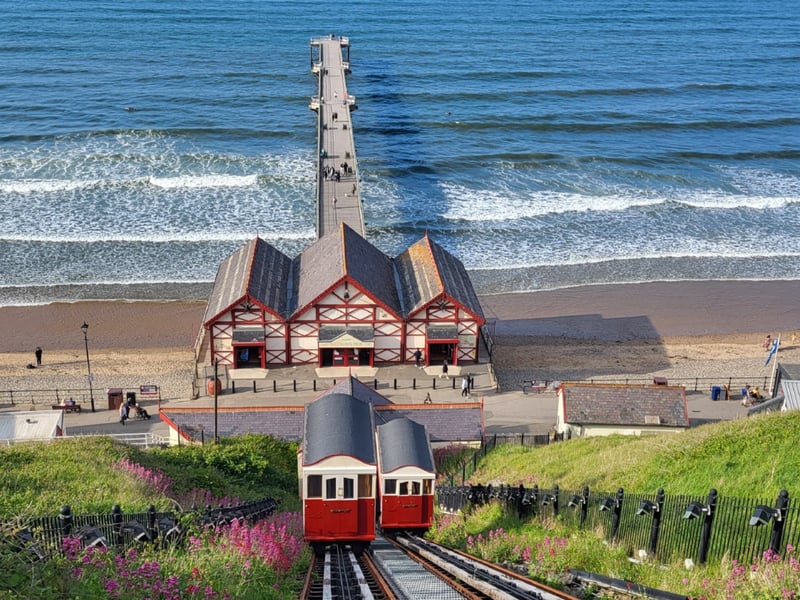
1. Redcar and Cleveland, North East, 7.6%
Redcar and Cleveland, North East, 7.6% | Mark Douglas/Wirestock Creators/Adobe Stock
2. Co Durham, North East, 6.6%
Co Durham, North East, 6.6% Photo: Submitted
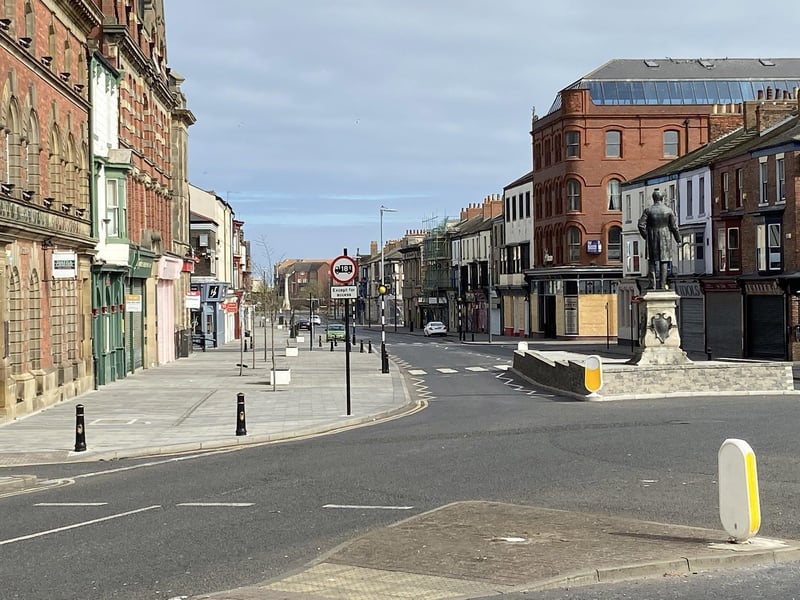
3. Hartlepool, North East, 6.5%
Hartlepool, North East, 6.5% Photo: Frank Reid

4. Burnley, North West, 5.8%
Burnley, North West, 5.8% Photo: Kelvin Stuttard